Distributed tracing with go-redis, Upstash and OpenTelemetry
In this tutorial, you will learn how to connect to Upstash Redis database using go-redis client and monitor performance of your app using distributed tracing.
What is go-redis?
go-redis is a popular Redis client for Golang. Out of the box, it supports Redis Server, Sentinel, and Cluster.
To connect to Upstash Redis database, use the following code:
package main

import (
	"context"
	"fmt"

	"github.com/go-redis/redis/v8"
)

func main() {
	ctx := context.Background()

	opt, _ := redis.ParseURL("<connection-string-from-Upstash>")
	client := redis.NewClient(opt)

	if err := client.Set(ctx, "foo", "bar", 0); err != nil {
		panic(err)
	}
	fmt.Println(client.Get(ctx, "foo").Result())
}
package main
import (
"context"
"fmt"
"github.com/go-redis/redis/v8"
)
func main() {
ctx := context.Background()
opt, _ := redis.ParseURL("<connection-string-from-Upstash>")
client := redis.NewClient(opt)
if err := client.Set(ctx, "foo", "bar", 0); err != nil {
panic(err)
}
fmt.Println(client.Get(ctx, "foo").Result())
}To execute arbitrary commands, you can also use an alternative API:
val, err := rdb.Do(ctx, "get", "key").Result()
if err != nil {
	if err == redis.Nil {
		fmt.Println("key does not exists")
		return
	}
	panic(err)
}
val, err := rdb.Do(ctx, "get", "key").Result()
if err != nil {
if err == redis.Nil {
fmt.Println("key does not exists")
return
}
panic(err)
}You can use go-redis to cache data or rate-limit requests to your API. To learn more about the client, see Redis Golang documentation.
What is distributed tracing?
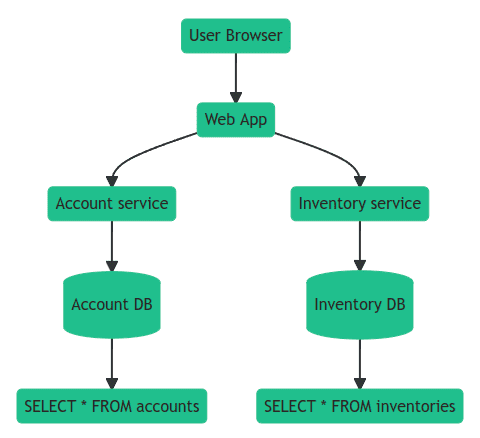
Distributed tracing allows to observe requests as they propagate through distributed systems, especially those built using a microservices architecture.
Tracing allows to follow requests as they travel through distributed systems. You get a full context of what is different, what is broken, and which logs & errors are relevant.

What is OpenTelemetry?
OpenTelemetry is a vendor-neutral standard that allows you to collect and export traces, logs, and metrics.
Otel allows developers to collect and export telemetry data in a vendor agnostic way. With OpenTelemetry, you can instrument your application once and then add or change vendors without changing the instrumentation, for example, here is a list popular DataDog alternatives that support OpenTelemetry.
OpenTelemetry is available for most programming languages and provides interoperability across different languages and environments.
Tracing and go-redis
go-redis comes with an OpenTelemetry instrumentation called redisotel that is distributed as a separate module:
go get github.com/go-redis/redis/extra/redisotel/v8go get github.com/go-redis/redis/extra/redisotel/v8To instrument Redis client, you need to add the hook provided by redisotel:
import (
    "github.com/go-redis/redis/v8"
    "github.com/go-redis/redis/extra/redisotel/v8"
)

rdb := redis.NewClient(&redis.Options{...})

rdb.AddHook(redisotel.NewTracingHook())
import (
"github.com/go-redis/redis/v8"
"github.com/go-redis/redis/extra/redisotel/v8"
)
rdb := redis.NewClient(&redis.Options{...})
rdb.AddHook(redisotel.NewTracingHook())To make tracing work, you must pass the active trace context to go-redis commands, for example:
ctx := req.Context()
val, err := rdb.Get(ctx, "key").Result()
ctx := req.Context()
val, err := rdb.Get(ctx, "key").Result()To learn more about redisotel, see Monitoring Go Redis Performance and Errors.
Uptrace
Uptrace is an open source DataDog competitor with an intuitive query builder, rich dashboards, automatic alerts, and integrations for most languages and frameworks.
You can install Uptrace by downloading a DEB/RPM package or a pre-compiled binary.
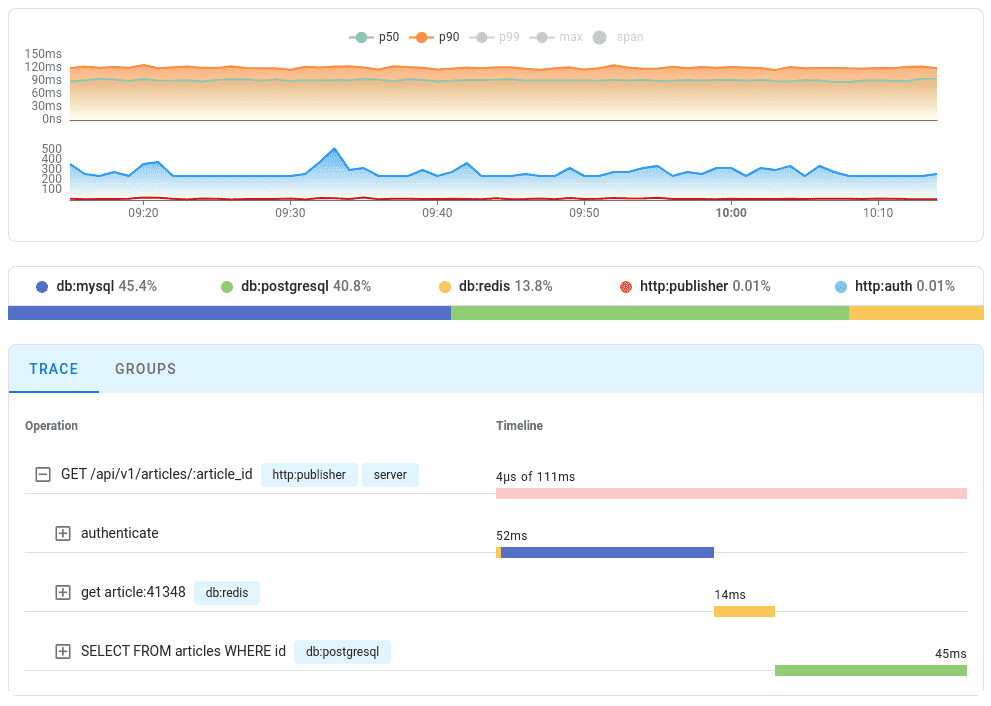
As expected, redisotel creates spans for processed Redis commands and records any errors as they occur. Here is how the collected information is displayed at Uptrace:

You can find a runnable example at GitHub.
What's next?
Next, you can install more OpenTelemetry instrumentations to monitor other aspects of the app, for example, Gin or Go gRPC.
You can also learn about OpenTelemetry Tracing API and Metrics API to create your own instrumentation.
