Low Maintenance Reporting Infrastructure using Athena, DynamoDB and Quicksight
Embracing the Data Driven Approach
It has been some time since we started making data-driven decisions at Upstash. The importance of supporting every decision made in a company with data is that you can have a reference point to measure the impact of the decision that has been made. You can see whether the numbers are going up or not, and those changes in numbers can surprise you, especially if they are coming from an unrelated source. Then you will have the ability to understand your customers even more, and this is priceless if you are dealing with tens of thousands of customers every single day directly and millions of them indirectly (perks of being a serverless data platform). In this writing, I will try my best to explain how we implemented the infrastructure that gives us all the answers we need with a couple of clicks on some dashboards.
Querying the Data and The Power of The Engine
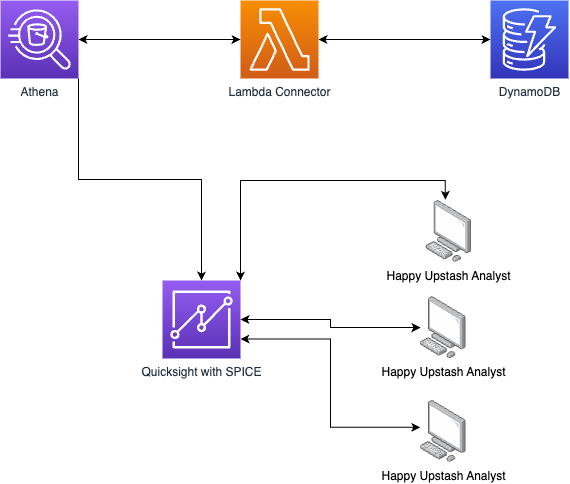
Our starting point was, of course, the architectural design of it. We wanted a solution with the least maintenance effort in the long term. All application-related data was already being stored on DynamoDB. This includes resource usages, plans, resource metadata, and everything you can imagine a SaaS company needs to run properly. We could have created a new relational database and some periodic ETL jobs to get all updates from DynamoDB to an RDS maybe. But then we would have to maintain the RDS cluster and all those ETL jobs. We decided to go with a serverless model. For this, we checked what we could do with AWS Athena, and we knew that we could actually use AWS Athena with sources other than S3. For this to work, AWS has introduced Data Source Connectors. The idea is simple: we are looking for answers using SQL, and a lambda function managed by AWS understands that query and gets the data from the source the way we want. In this case, the source is DynamoDB. This way, we got rid of all the work needed to have a relational database, as we now have one logically generated on the fly. With data source connectors, each time you open the Athena dashboard, you would see that the UI is working on something before showing you the tables available. What really happens there is it infers the schema of all the tables in DynamoDB by looking at the fields on the first record of each table. At this point, we hit our first limitation.

We were using DynamoDB as a NoSQL database, as it is. This means not all fields are populated for each record in a table. For example, only a bunch of databases might have some feature enabled, then we don't set any detail about this specific feature to the rest of the records as this would have increased the size of the table unnecessarily. But when we wanted to get database records with that feature enabled, using Athena, we simply failed as Athena was saying there was no such field. In this case, the solution was simple enough. Nothing was preventing us from setting required fields to the first record of the databases table as we actually never delete a record, just update some fields on them. This solves the biggest flaw in Athena Source connector for DynamoDB. At this point, we had an engine that gives us the results we want using good old SQL queries. On top of that, and a very important benefit from using Athena was that we were able to use all those Presto functions supported. This gave us a lot of flexibility on aggregation calculations with window functions and partitions. So that we did not have to sit in silence for a very long time to figure out how to calculate the percent change in revenue brought by some specific feature. We only had to sit in silence for a couple of minutes until we felt the lightning storm on our heads indicating that we have a solution, a query to be more specific.
An example query that we used for generated a column for us to be used later in dynamic filtering shown below:
select
...
LAG(amount,1) OVER (PARTITION BY r.database_id, r.source ORDER BY date ASC) previous_amount
...
from
....
select
...
LAG(amount,1) OVER (PARTITION BY r.database_id, r.source ORDER BY date ASC) previous_amount
...
from
....The Speed and Visualization
Now there is one problem. Yes, we can get some answers by writing those queries. But it is very impractical to copy-paste them into Athena each time we want to get some answers. Also, there is a cost associated with this action. A lambda function runs, and we are using our DynamoDB limits, which are used for our production systems. So it is not okay to have many people simultaneously searching for answers in real-time using Athena over and over again. The purpose was not to create a monitoring infrastructure, which would make a whole another blog post, but to create a reporting infrastructure. So accessing the data in real-time was not a requirement, and at best, it would have been over-engineering. Luckily, there was another service we know of in AWS to cache those answers for us and show them in a nice way with graphs in some dashboards. That service is QuickSight. It has a native integration with Athena, which is nice because this aligns with our requirement not to have an infra that we maintain ourselves. In QuickSight, you generate Datasets. In this case, a dataset can have a single source of a table or a combination of many datasets; moreover, the source mentioned here can be a result of a query. This brought us a lot of flexibility in how we shape our data. Now we come to the caching feature. In QuickSight, you can use an in-memory storage called SPICE. When you combine SPICE with periodic refreshes, you have cached responses for all of your questions. In this case, when you open a dashboard in QuickSight, it won't go and run the connector lambda function and use your DynamoDB limits, but it will get the data from memory, which saves both time and money. Of course, one must be careful in choosing the correct refresh schedule for those datasets, especially if a dataset is a combination of two or more.
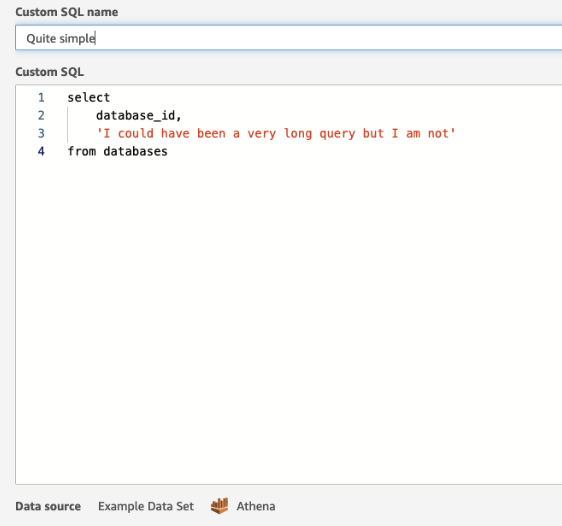
Below is a look at the dataset editor in Quicksight where you can write any query as long as it is supported by the source engine:

Answers
At this point, we had a visualization tool that holds the source data in memory, which helps us to save some cost and time. Now we could start generating some graphs and huddle them inside dashboards. Luckily, we had many questions on our hands that were waiting eagerly to get their answers. After combining all these components together, it was a piece of cake to click on some fields on the QuickSight UI to see what is going on at Upstash. At that point, we started to discover the perks of QuickSight. When you need to answer many questions with graphs and tables, you want to be efficient. It would be a mess if you create a new graph to answer each question, which gives you hundreds of them at the end. This wouldn't have been aligned with the desire to maintain less. Instead, we have gone with dashboard parameters and used them to dynamically filter the data shown on the graphs. We could target only specific graphs or we could target the whole dashboard. With one dashboard, we could see the whole history of resource usages for all customers or, with just two clicks and pushing some buttons on the keyboard, we could focus on a specific customer's behaviors, their whole history in detail. This was a lifesaver, especially when you don't know how to define some thresholds for success or failure. Let's say, during a board meeting, management wants to see what would have been our revenue if we were cheaper. Just go and click on that slider, sir, then you will get your answer.
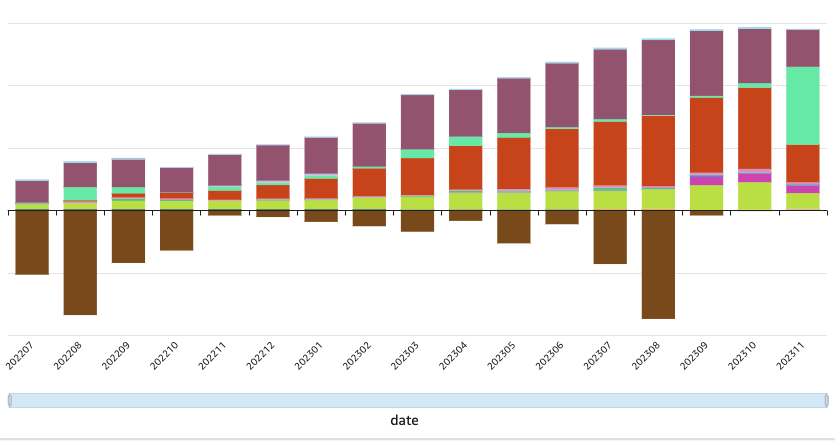
Example visualization of a data from DynamoDB(not real values, of course...):

Conclusion
All in all, we are very happy that we actually have a very simple solution to a very complex problem, and we don't have to maintain anything other than Upstash itself.
A final look to the final architecture:

